React生态
React DevTools
General 设置
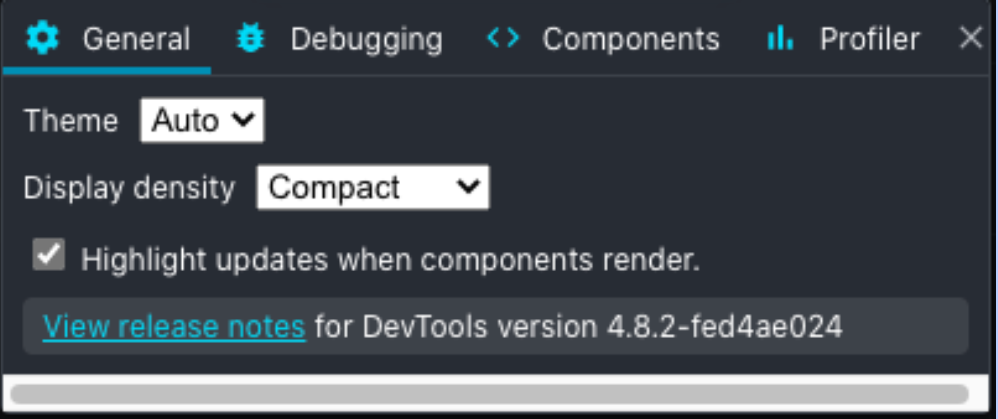
General 面板中最重要的功能就是 **”Highlight updates when components render”**。勾选上之后,可以查看 React 重绘时,页面哪些部分有更新。在遇到性能问题时,可以快速帮助决策在哪部分不需要重绘的组件部分添加 React.memo 阻止重绘。
Debugging 设置
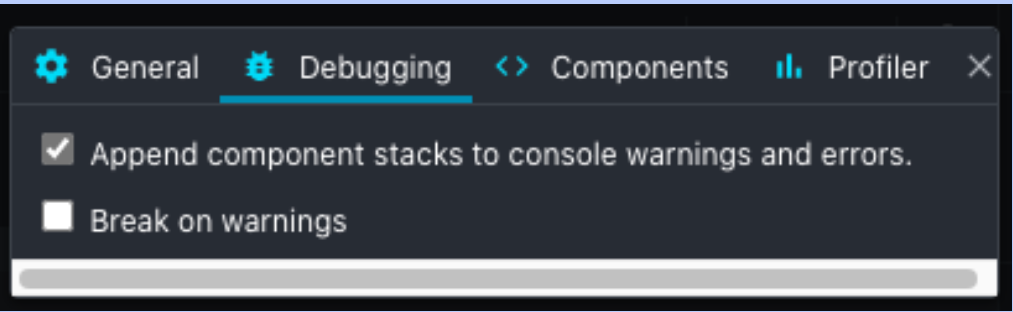
“Append components stacks to console warnings and errors.”
可以帮助我们定位 React 报错信息来自哪个组件
Components 设置
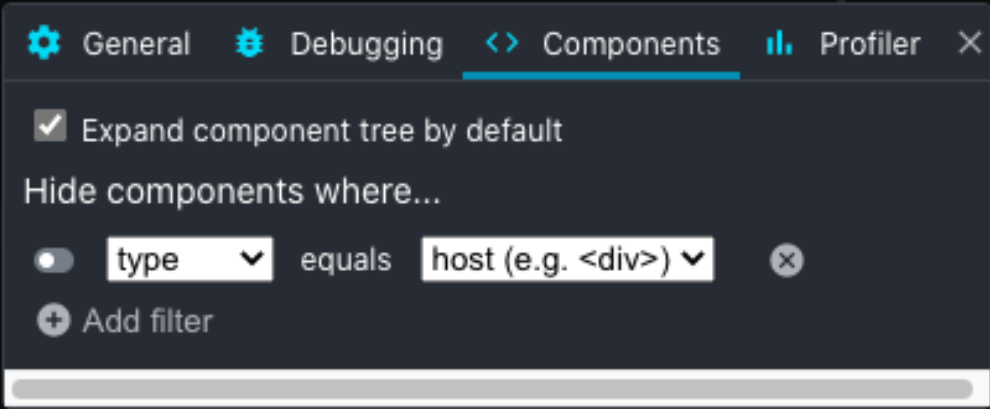
“Hide components where…”
此项在过滤组件树时有用。比如,大多数应用可能会在顶层有很多 Context.Provider,就可以过滤 Context 类型、不显示。当我们只关心业务逻辑层的组件时,可以过滤掉 DOM 组件,减少树的节点
Profiler 设置
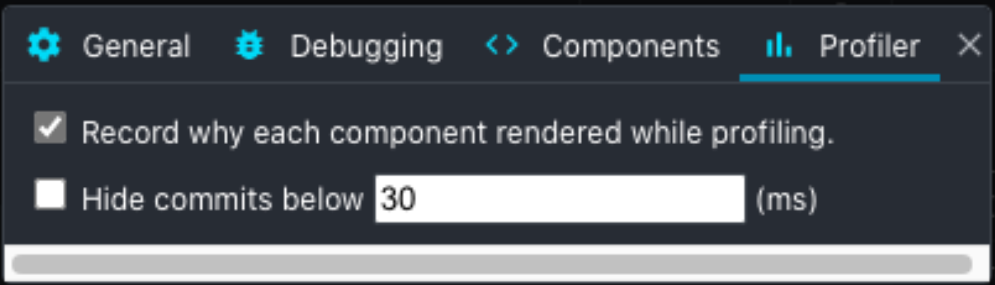
“Record why each component rendered while profiling”
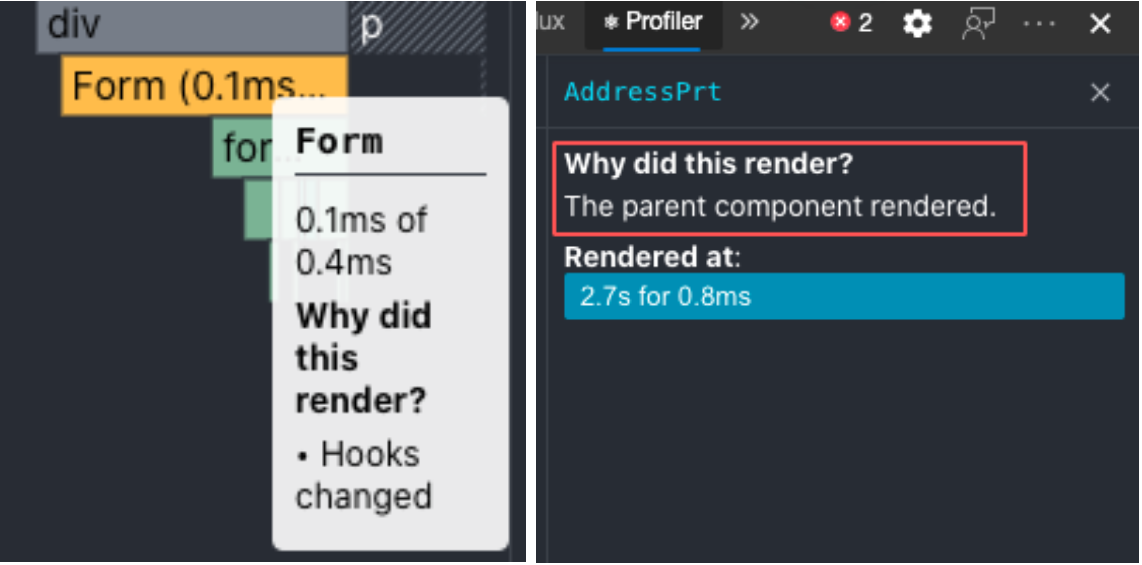
勾选之后会在渲染火焰图的 hover 面板中看到 **”Why did this render”**。
现在有哪些 render 原因呢?
Props changed
顾名思义,传入组件的 props 变更
The parent component rendered
父组件渲染导致的子组件渲染。一般要做性能优化都是找这类重绘原因的组件。但是要注意,如果组件中有用到 useContext,Provider 的 value 变更导致的重绘也是被标记为 The parent component rendered,需要注意
Hooks changed
Hook 状态变更导致的重绘,一般就是指 useState 返回的更新函数被调用了
State changed
这个只会在 class component 中有,大家忽略
“Hide commits below xx (ms)”
设置一个更新耗时的阈值,低于该阈值的渲染不显示。用来快速过滤哪些渲染有性能问题
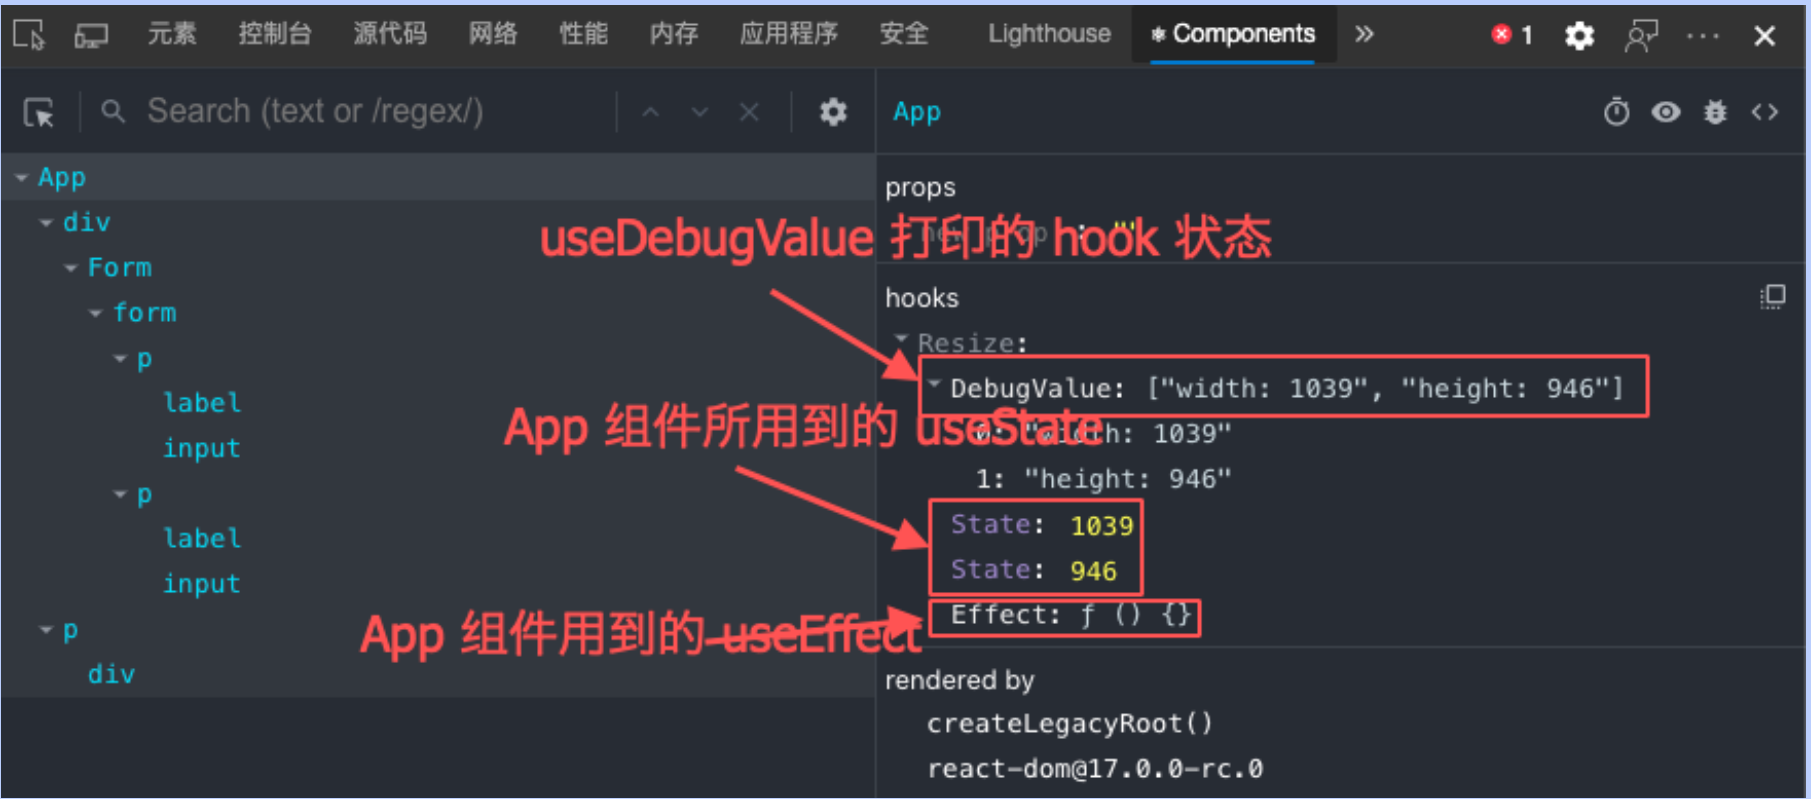
React 组件检视器
用法和 DevTools 的元素面板类似,可以直接在页面上定位到元素对应的 React Component。并且可以实时查看当前组件内部的 hooks 状态,返回的组件树
右上角的四个图标

分别作用如下:
- 模拟 ReactLazy 懒加载组件 Suspense 状态
- 定位组件所渲染的 DOM 节点
- 在 Console 中打印 Component 内部状态
- 跳转到组件所在源文件(配合 sourcemap)